A Gantt Chart in Half an Hour
How AI applied to a sample chart changed my pre-construction workflow.
The tool that has changed my pre-construction workflow is not a new scheduling platform. It is not a project management subscription. It is AI applied to a sample Gantt chart.
I can now put a professional, logically sequenced work program in front of a client in around half an hour. Not a rough sketch. Not a placeholder. A document that shows phases, tasks, durations, dependencies, and timeline logic, detailed enough to drive a real conversation.
The real value is that the chart can inherit project logic, staging assumptions, task sequencing, durations, dependencies, and your own project requirements, from a conversation, not from hours of manual entry.
Four starting points, one structure.
Three steps. That is the whole process.
The workflow has three stages. Each one builds on the last. The output at the end is something you can take into a client meeting, a planning conversation, or a feasibility discussion and use directly.
Each codebase is a React + TypeScript + Vite project. The structure — phases, tasks, timeline logic, and date calculations — is already embedded. You are not starting from zero.
Import the codebase into Gemini AI Studio, Claude, ChatGPT, or your preferred tool. Then chat. Describe the project type, location, start date, overall duration, and key stages. The AI reads the existing structure and adapts it to your brief.
Do not trust the first output blindly. Review the task sequence, dates, durations, overlaps, and dependencies. Ask AI to revise anything that feels unrealistic, missing, or incorrectly staged. Iterate until the program logic makes sense for your project.
What to say to AI.
The prompt does not need to be complex. It needs to give the model enough context to make sensible staging decisions. Project type, location, start date, overall duration, and the phases you care about.
“Change this into a 9-month childcare centre fitout program starting July 2026. Include design coordination, permits, procurement, construction, services, finishes and handover. Adjust the task names, durations, phase groups and timeline logic to suit the project.”
That single instruction, attached to a sample codebase, will produce a structured program with sequential phases, realistic overlaps, and labelled tasks. It is a starting point, but a far better starting point than a blank sheet.
This does not replace project judgement.
A Gantt chart produced this way is a starting point, not a finished document. The AI will make reasonable staging assumptions based on general construction logic. It does not know your specific site conditions, your subcontractor availability, your council's permit processing time, or the procurement lead times for the materials you are specifying.
You still need to check the sequence, dates, overlaps, and assumptions. What the tool gives you is a logical scaffold to interrogate, not a schedule to hand to a contractor.
What this changes for architects and project managers.
The barrier to producing a work program has always been time and software familiarity. Scheduling tools are powerful but slow. The setup cost — learning the interface, entering tasks manually, adjusting logic rules — is high relative to the value at early project stage.
AI removes that barrier. The template carries the structural intelligence. The prompt carries your project context. The AI does the assembly. You check and refine the output. The conversation with your client is better for it.
It turns rough project thinking into something clear, visual, and discussable. For architects and project managers, this is where AI becomes practical, not as a novelty, but as a tool that earns its place in the workflow.
Grab a template and start the conversation.
Each codebase is a React + TypeScript + Vite project with the schedule structure already embedded. Download one, attach it to your AI tool, and describe your project.
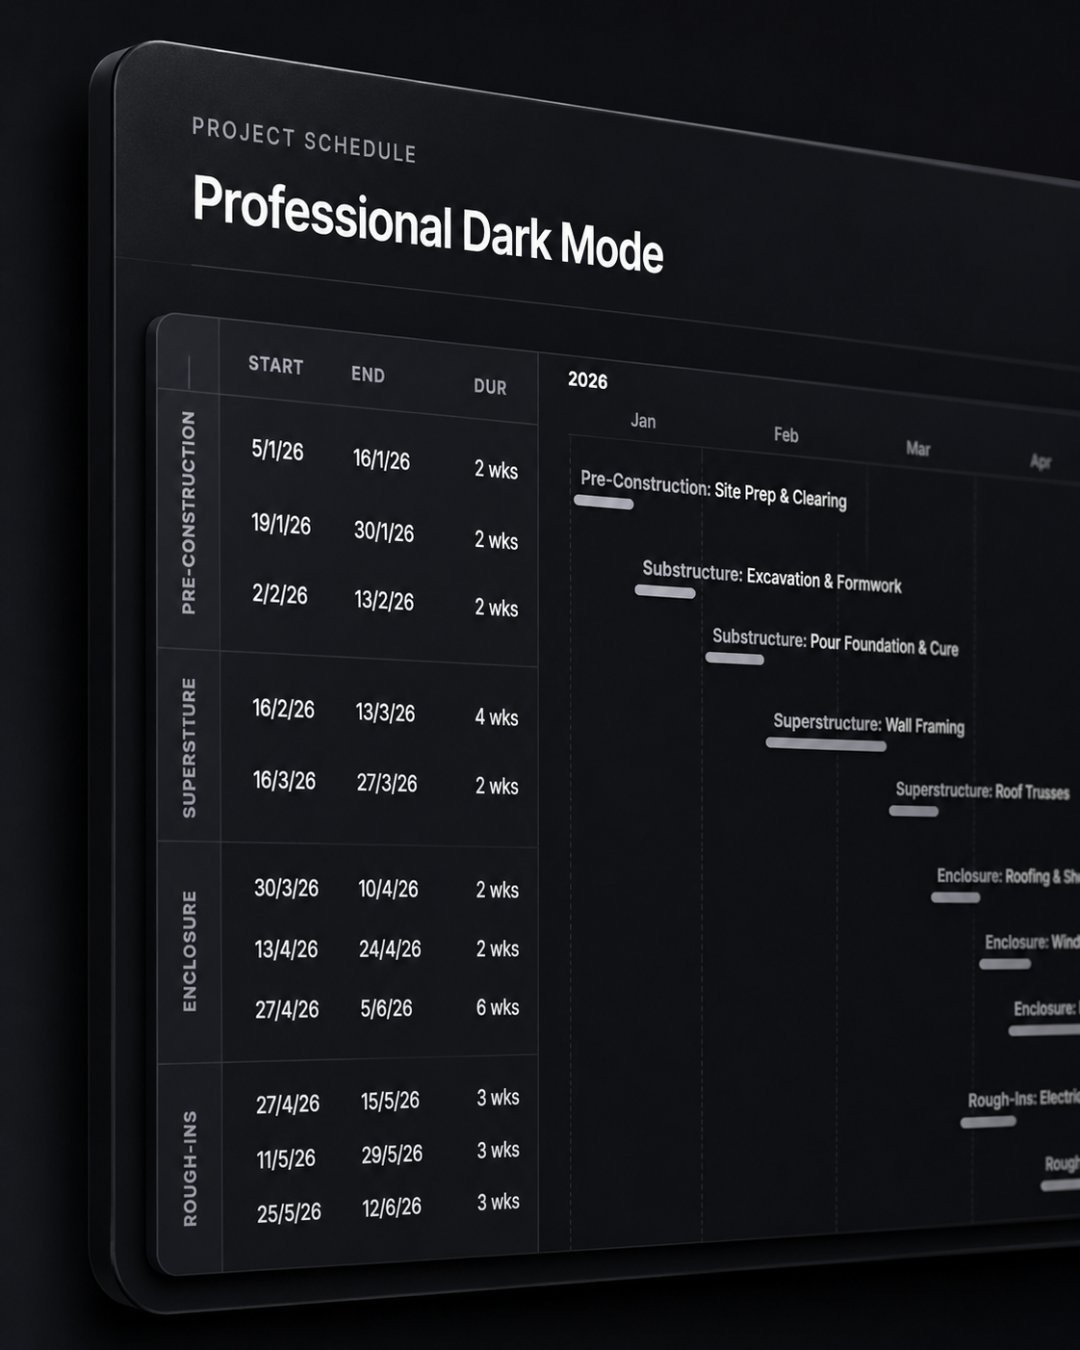
High-contrast dark theme. Monochrome bars.
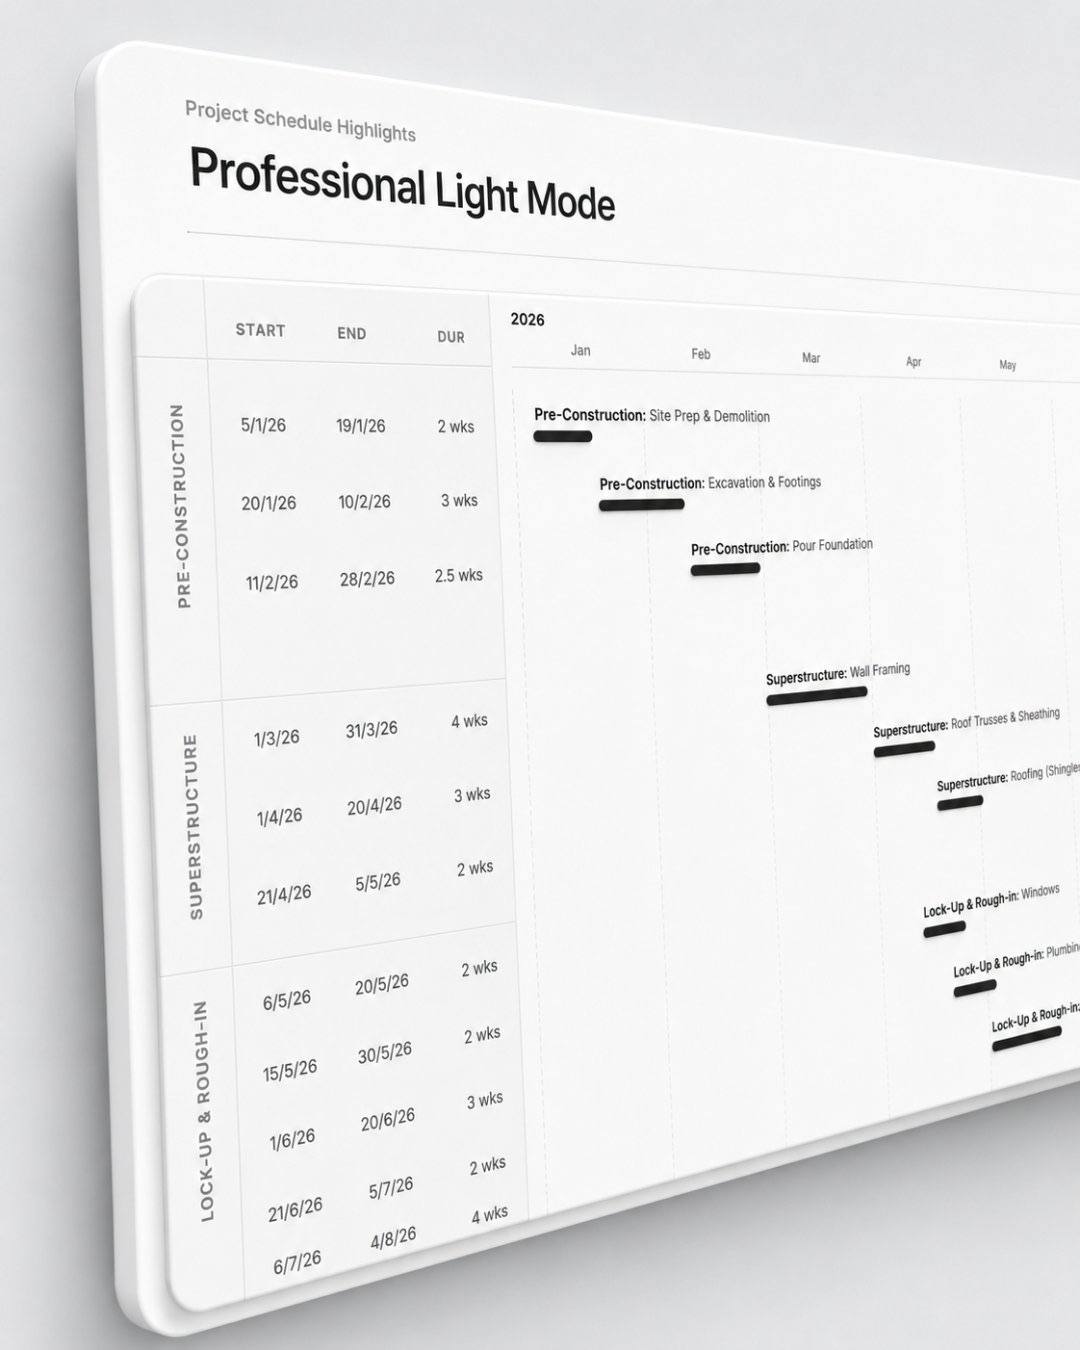
gantt_chart_dark_mode.zipClean white background. Bold black bars. Print-ready.
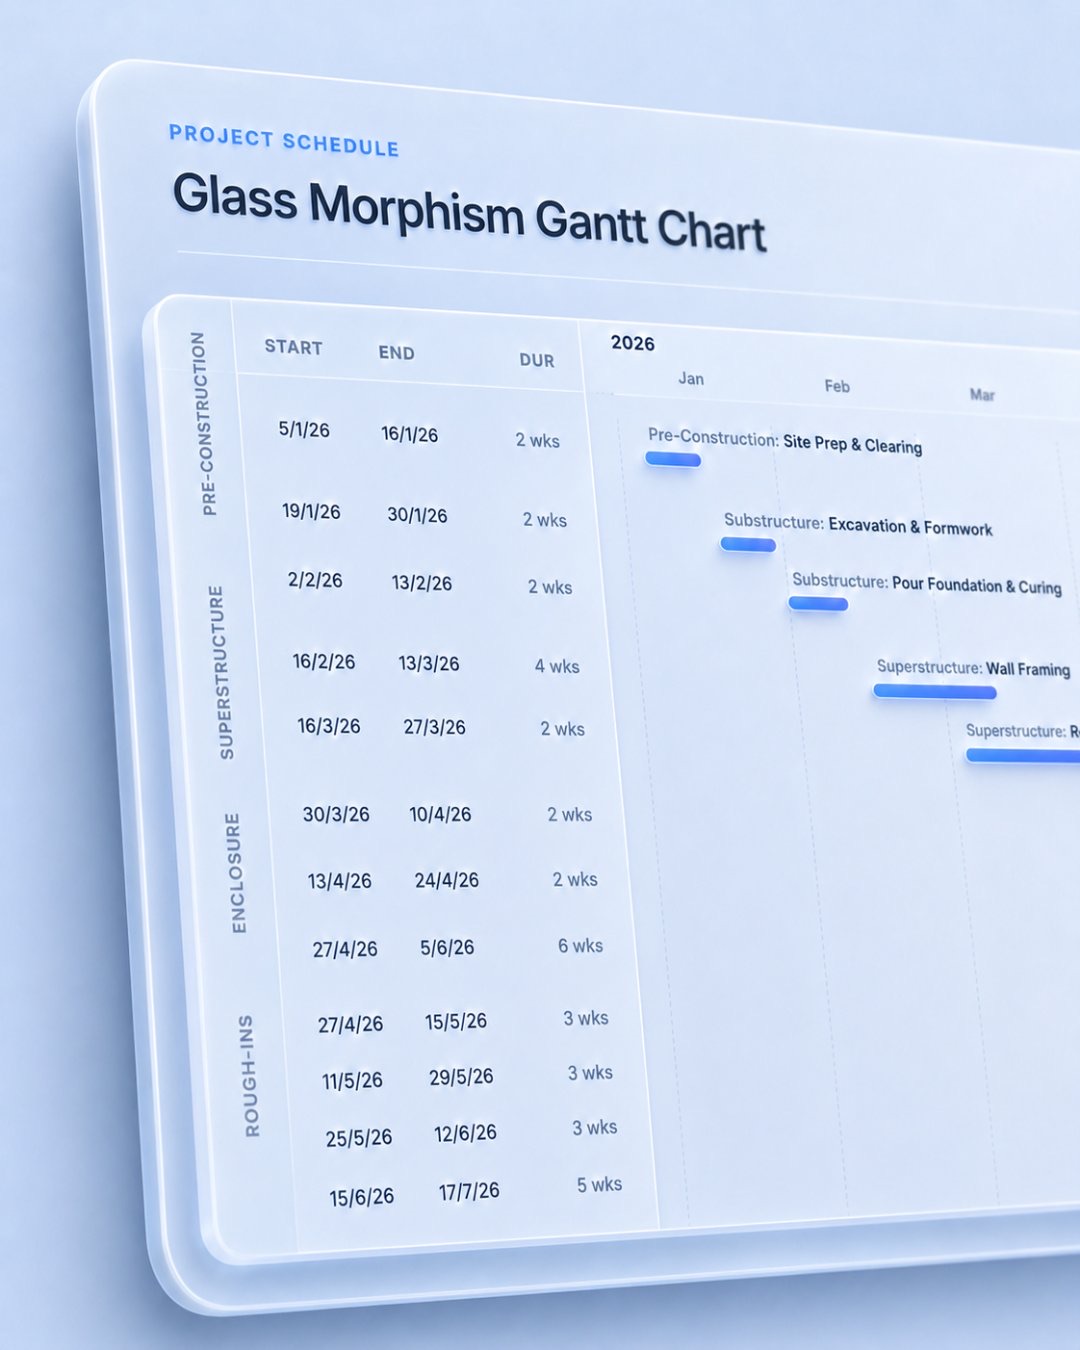
gantt_chart_minimalist_white.zipFrosted glass card on a blue gradient. Blue accent bars.
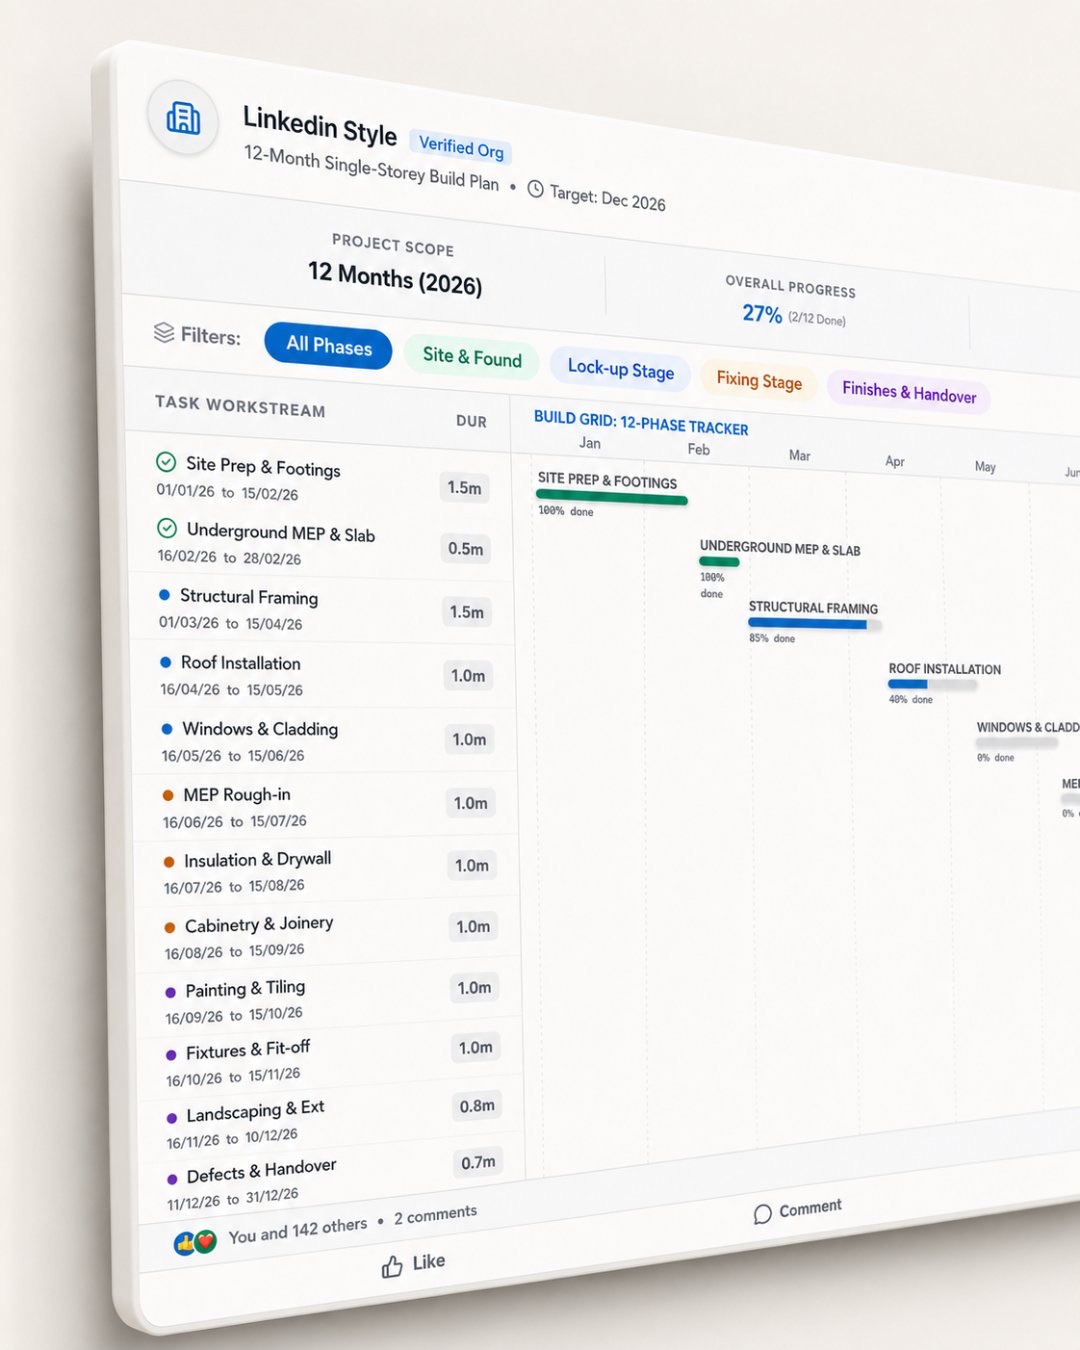
gantt_chart_glass_morphism.zipInteractive 12-phase tracker. Sliders, filters, live tracking.
gantt_chart_linkedin_style.zip